

Testing race conditions with memory access tracing and stack-based delay injection
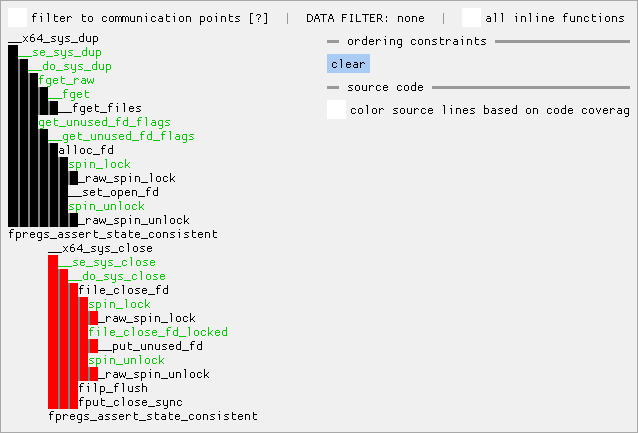
This project focuses on developing tools for identifying and testing race conditions in the Linux kernel. The core idea is to analyze memory access patterns and potential interleavings of multi-threaded test cases. The tools leverage ASAN instrumentation to collect memory access coverage and then use count-augmented stack traces to identify stable memory access points across test case executions. Crucially, the project incorporates delay injection techniques – both constraint-style (allowing for some non-deterministic interleaving) and fully-specified ordering – to force specific execution orderings and expose race conditions. The tools are built around KCOV, a coverage mechanism, and utilize a combination of ASAN and TSAN instrumentation to detect memory safety violations.
This project aims to improve the detection and testing of race conditions within the Linux kernel. Race conditions occur when the outcome of a program depends on the unpredictable order in which threads execute, often due to shared resources and concurrent access. Identifying these bugs can be extremely challenging, requiring extensive manual analysis and often relying on reproducing specific, hard-to-trigger interleavings.
Many existing approaches involve manually reading code and writing test cases to reproduce problematic scenarios. However, this is time-consuming and often fails to capture all possible interleavings. Furthermore, after fixing a race condition, it can be difficult to write a regression test that reliably triggers the bug again.
To address these challenges, the project utilizes a combination of instrumentation and analysis techniques. The core of the approach is to trace memory accesses of all threads and search for pairs of accesses on two threads that could interact with each other – meaning, roughly, that at least one of them is a write operation, and they access overlapping memory ranges. These memory accesses are termed "communication points." The tools leverage KCOV, a coverage mechanism, to record information about memory accesses.
To enable exploration of different execution orderings, the project implements delay injection. This involves setting flags that control when threads should wait or wake up, effectively forcing specific interleavings. There are two primary approaches: constraint-style delay injection (allowing for some non-deterministic interleaving) and fully-specified ordering (where execution order is precisely defined).
The tools are built around ASAN (Address Sanitizer) and TSAN (Thread Sanitizer) instrumentation. ASAN is primarily designed for detecting UAF (Use-After-Free) errors, and by default, it doesn't emit helper calls on direct stack memory access unless there's potential for out-of-bounds access. TSAN is designed for detecting data races and provides information about access atomicity. The project patches ASAN to disable its helper call merging optimization, ensuring that each memory access is reported with a callback. TSAN is used to detect data races and provides information about access atomicity.
KCOV (Kernel Coverage) is used to record information about memory accesses. The tools use KCOV to collect basic block kernel coverage information, which is then fed to userspace. To enable exploration of different execution orderings, the project implements an ioctl KCOV_SET_DI using which userspace can request that actions (essentially wait/wake) are taken on memory accesses at specific count-augmented stack traces. This allows userspace to define constraints or fully specify the desired execution order.
To make this work, KCOV must provide information about function entry/exit events so that when userspace is parsing KCOV coverage output, it can keep track of how the call stack changes. This requires compiler support as part of SanitizerCoverage, which landed in the LLVM 23.1.0 release. The project also utilizes count-augmented stack traces, where each stack trace element consists of a callee function address and a number indicating how many calls to this callee should be skipped in the calling stack frame. This unambiguously identifies a point in an execution trace, is independent of concrete data addresses, and is relatively stable with regards to changes in the control flow of irrelevant parts of the trace.
This project is inspired by discussions with Ned Williamson, whose sockfuzzer project involved exploration of concurrency bugs by using a custom scheduler that can reschedule at synchronization primitives to explore interleavings. The tools are available on GitHub under the name MAccConc, short for âMemory Access Concurrencyâ; see the README there for installation and usage instructions.